How Visual Management can reduce waste processes? Part Two
How Visual Management can reduce waste processes? Part Two
Visual Management significantly does help our manufacturing environments but firstly what does this term mean and how does its implementation reduce waste processes?
In this next blog episode, I will explain by using another 4 “Wastes” which are often seen in practical situations in the workplace. For each waste I will provide areas and examples in which visual management can negate their harmful aspects and support continuous improvement.
Ok, so what is Visual Management?
The term is now often used to describe visual signals that have a practical purpose in changing or guiding human behaviour. We as humans are visual and are constantly making and interpreting meanings from our surroundings. Within the Manufacturing environment C. I’s, Production & Lean Managers can greatly enhance their reduction of waste processes by utilising visual triggers around the workplace. Whether these are signs, labels, floor marking, layouts or colour coding, all sorts of techniques. Basically, what we see is often what we do. For example, provide a Visual Standard of a process next to a workstation and everyone knows the structure of the action straight away.
Waste Five: Defects:
Defects can impact time, money, resources and ultimately customer satisfaction. Defects result from poor documentation or standards. If Quality Controls are not in place or sufficiently sustained, then defects will start to creep into the manufacturing environment.
How can we alleviate this waste? In Visual Management terms, appropriate Standards or Guide printed close to assembly stations will ensure defects do not get a hold in the processes. We often include Document Holders with printed visual guides of assembly steps onto Tool Workstations and Work Benches close to operators.
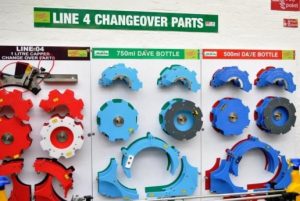
Tool Shadow Board Stations will also support increased awareness of defects in tooling, change-over parts etc. Proper storage of the tools required to fabricate a product must be actively looked after.
Waste Six: Over Production:
Over production can occur when components are produced before they are required. The effect of the over production means there is excess work in progress (WIP) within the process. Excess WIP leads to more staging of materials and therefore the labour to deal with the WIP increases.
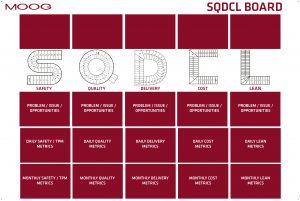
So how can forms of visual management alleviate this particular waste? Well, if Over production is occurring a better balance between production rates between the different cells or departments needs to be addressed. Creating process -mapping of a job can significantly reduce setup times as well as proper reporting and display of forecasts and demand data. Perhaps use of SQDC Board may improve communications and help support an ethos of daily metrics that continuously improve your workplace.
Waste Seven: Waiting
All waiting can cost an organisation in terms of people waiting, materials or idle equipment.
Waiting can be viewed as the opposite to Over Production but can be mitigated by many of the same visual management techniques.
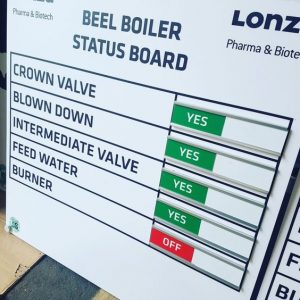
Reporting of events and data quickly is key to reduce waiting in any process. Again, look at creating simple visual Standards or Status Boards to quickly identify important elements of a process to operator and manager alike.
Waste Eight: Extra- Processing:
Excess processing is a key indicator of a poorly designed process. Perhaps unclear management or administrative communication, duplication of data or overlapping areas of authority are hindering the process.
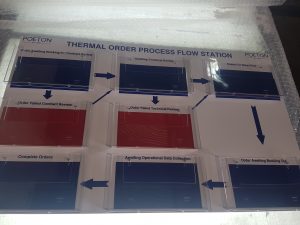
Have a look at improving the facility layout or how each workstation is organised in terms of their specific tooling. Create a process mapping visual which will support elimination of waste by identifying and define the optimal workflow for your company. Custom Whiteboards with the process mapping that are situated close to walk-through areas will significantly improve in reducing Extra Processing.
To summarise then, we make sense and organise our behaviour as humans mostly through visual means. As practitioners in the workplace, we can utilise this human trait to better organise ourselves, our space and our organisations as a whole. Better visual cues or triggers will shift people’s behaviour into making better choices that will support and help processes to become leaner and more efficient.
If you have any questions or wish to discuss how our range of Custom visual management products and our services can help your organisation, then get in touch with Lean 5s today!
